Introduction:
The recent breakout in the financial markets has brought attention to a long-term triangle pattern that began forming in February 2023. On July 12, 2023, the breakout occurred as a response to the release of the year-over-year (YoY) inflation numbers, which came in lower than expected at 3%. This blog post delves into the significance of this technical pattern and how the inflation figures, combined with market expectations of a potential pause in interest rate hikes by the Federal Reserve (Fed), acted as catalysts for the downside breakout.
The Formation of the Triangle Pattern:
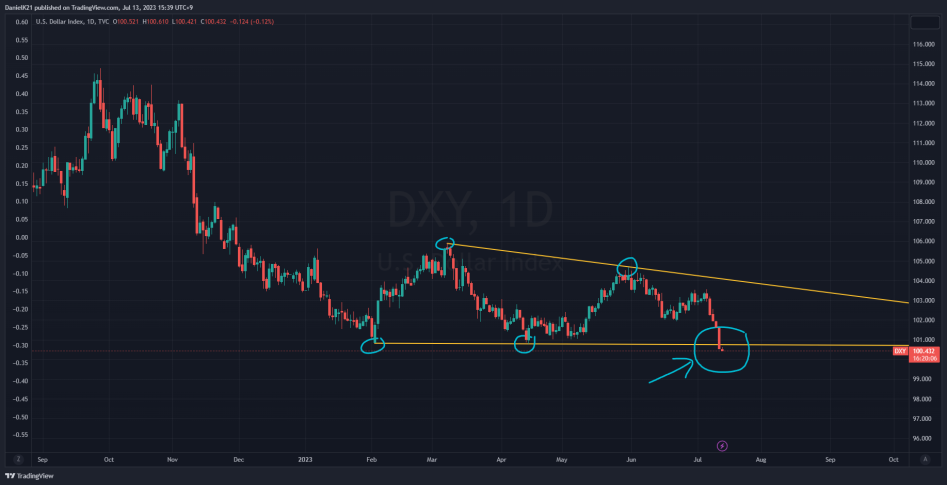
Since February 2023, market participants have been observing the development of a triangle pattern in the financial markets. This technical pattern is characterized by a series of lower highs and higher lows, creating converging trendlines that form the shape of a triangle on the price chart. The narrowing price range indicated a period of consolidation and uncertainty as buyers and sellers vied for control.
The Breakout Catalyst: YoY Inflation and Market Expectations:
The breakout of the triangle pattern occurred on July 12, 2023, following the release of the YoY inflation numbers, which unexpectedly came in at 3%, lower than market expectations. This news had a profound impact on market sentiment and fueled the downward move in prices.
The lower-than-expected inflation figures led market participants to reassess their expectations regarding the Federal Reserve’s monetary policy. With inflation under control, there was speculation that the Fed might reconsider its plans for further interest rate hikes. This shift in sentiment triggered selling pressure, prompting the downside breakout of the triangle pattern.
Market Reaction and Implications:
The breakout from the triangle pattern resulted in significant market movements across various asset classes. Investors reacted to the inflation data by adjusting their portfolios and positioning themselves accordingly.
Equity markets witnessed a decline as investors priced in the implications of lower inflation. Sectors that had previously benefited from inflationary expectations, such as commodities and cyclical industries, experienced downward pressure. Conversely, sectors that tend to perform well in lower inflation environments, such as technology and consumer discretionary, showed relative strength.
Bond markets also experienced notable movements. The expectation of a potential pause in interest rate hikes by the Fed led to a decline in bond yields, as investors anticipated lower borrowing costs. This had an impact on fixed-income investments and resulted in a shift in investor preferences within the bond market.
Conclusion:
The breakout of the long-term triangle pattern, which had been forming since February 2023, occurred on July 12, 2023. The catalyst for this breakout was the release of lower-than-expected YoY inflation numbers and market expectations of a potential pause in interest rate hikes by the Federal Reserve. This news reshaped market sentiment and prompted a downward move in prices across various asset classes. As investors continue to assess the implications of this breakout, it is important to stay informed and adapt investment strategies to the evolving market conditions.